
 EN
EN


Check out figures and service's evolution 6z3x3t
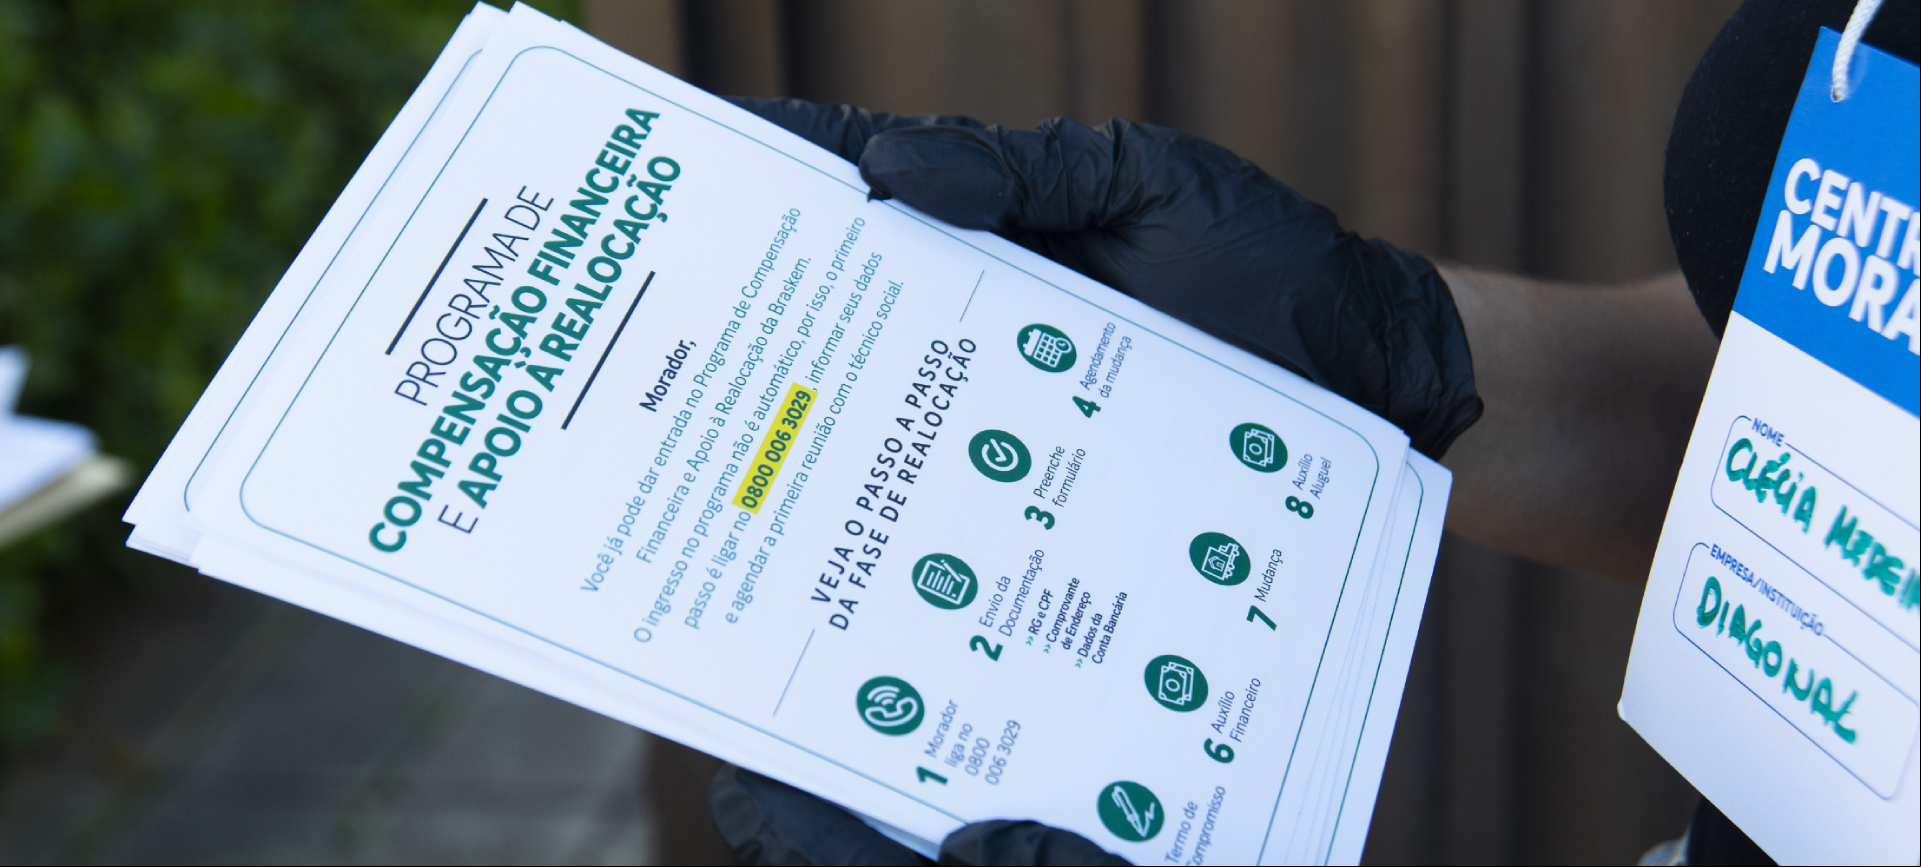
You will find updated data on the Financial Compensation and Relocation Program (PCF) on this page. The purpose is to ensure even more transparency and ability to society on the evolution of service to households, traders, and entrepreneurs in the evicted and monitoring zones in Maceió. 5f1p9
The PCF was created in November 2019 to benefit residents within the protection zone around the salt wells, being later expanded to include residents, traders, and entrepreneurs within the evicted and monitoring zones designated by the Civil Defense, under an agreement signed in January 2020 with the relevant authorities*.
* Federal Prosecution Office (MPF), Public Prosecution Office of the State of Alagoas (MPE), Federal Public Defender's Office (DPU), and Public Defender's Office of the State of Alagoas (DPE)

-
14.5 THOUSAND PROPERTIES identified in the evicted and monitoring zones;
-
14.5 THOUSAND PROPERTIES evicted;
-
19,190 COMPENSATION PROPOSALS submitted;
-
19,051 COMPENSATIONS paid;
-
6,166 COMPENSATION PROPOSALS submitted to traders and entrepreneurs;
-
More than BRL 4.2 BILLION PAID in compensation and financial aid.
- Updated on (04/30/2025)

*The figures shown in the graph are aggregate sums for the months
The difference between the number of submitted/accepted proposals is due to the deadlines within which families have to review the amounts offered and/or request reanalysis of the submitted proposal.
Such data is reported monthly by Braskem to the authorities that signed the Agreement term in January 2020.
Click below to see monthly PCF data for residential properties: 5v3z5h

MAY 2024 - RESIDENCES 2k3r1o
| Eviction map areas | Identified Properties | Evicted Properties | Pending Eviction Properties | Accepted Proposals |
|---|---|---|---|---|
| Protection | 513 | 513 | 0 | 647 |
| Zone A | 1,633 | 1,633 | 0 | 1,954 |
| Zone B | 77 | 77 | 0 | 88 |
| Zone C | 154 | 154 | 0 | 184 |
| Zone D | 2,814 | 2,814 | 0 | 3,380 |
| Zone E | 2,626 | 2,626 | 0 | 3,469 |
| Zone F | 61 | 61 | 0 | 89 |
| Zone G | 2,380 | 2,380 | 0 | 3,154 |
| Zone H | 1,398 | 1,398 | 0 | 1,944 |
| Total area 00 | 11,656 | 11,656 | 0 | 14,909 |
| Area 01 | 2,888 | 2,844 | 44 | 3,889 |
| Overall Total | 14,544 | 14,500 | 44 | 18,798 |
Data from Area 00 considers evictions that occurred after a court order by the Civil Defense of Maceió until December 2, 2023. Area 00 is totally evicted. 1. It does not consider large equipment, Braskem properties, and other cases that will be treated separately 2. Properties that entered PCF through the Technical Board and overlap the area set in the new Agreement are ed for by the geographical criterion
JUNE 2024 - RESIDENCES 3c6w64
| Eviction map areas | Identified Properties | Evicted Properties | Pending Eviction Properties | Accepted Proposals |
|---|---|---|---|---|
| Protection | 514 | 514 | 0 | 648 |
| Zone A | 1,633 | 1,633 | 0 | 1,954 |
| Zone B | 77 | 77 | 0 | 88 |
| Zone C | 154 | 154 | 0 | 185 |
| Zone D | 2,814 | 2,814 | 0 | 3,384 |
| Zone E | 2,627 | 2,627 | 0 | 3,475 |
| Zone F | 61 | 61 | 0 | 89 |
| Zone G | 2,380 | 2,380 | 0 | 3,158 |
| Zone H | 1,398 | 1,398 | 0 | 1,946 |
| Total area 00 | 11,658 | 11,658 | 0 | 14,927 |
| Area 01 | 2,888 | 2,845 | 43 | 3,895 |
| Overall Total | 14,546 | 14,503 | 43 | 18,822 |
Data from Area 00 considers evictions that occurred after a court order by the Civil Defense of Maceió until December 2, 2023. Area 00 is totally evicted. 1. It does not consider large equipment, Braskem properties, and other cases that will be treated separately 2. Properties that entered PCF through the Technical Board and overlap the area set in the new Agreement are ed for by the geographical criterion
JULY 2024 - RESIDENCES 83i56
| Eviction map areas | Identified Properties | Evicted Properties | Pending Eviction Properties | Accepted Proposals |
|---|---|---|---|---|
| Protection | 514 | 514 | 0 | 648 |
| Zone A | 1,633 | 1,633 | 0 | 1,958 |
| Zone B | 77 | 77 | 0 | 88 |
| Zone C | 154 | 154 | 0 | 186 |
| Zone D | 2,818 | 2,818 | 0 | 3,389 |
| Zone E | 2,626 | 2,626 | 0 | 3,484 |
| Zone F | 61 | 61 | 0 | 89 |
| Zone G | 2,380 | 2,380 | 0 | 3,167 |
| Zone H | 1,398 | 1,398 | 0 | 1,950 |
| Total area 00 | 11,661 | 11,661 | 0 | 14,959 |
| Area 01 | 2,888 | 2,847 | 41 | 3,905 |
| Overall Total | 14,549 | 14,508 | 41 | 18,864 |
Data from Area 00 considers evictions that occurred after a court order by the Civil Defense of Maceió until December 2, 2023. Area 00 is totally evicted. 1. It does not consider large equipment, Braskem properties, and other cases that will be treated separately 2. Properties that entered PCF through the Technical Board and overlap the area set in the new Agreement are ed for by the geographical criterion
AUGUST 2024 - RESIDENCES 622x1g
| Eviction map areas | Identified Properties | Evicted Properties | Pending Eviction Properties | Accepted Proposals |
|---|---|---|---|---|
| Protection | 514 | 514 | 0 | 649 |
| Zone A | 1,633 | 1,633 | 0 | 1,959 |
| Zone B | 77 | 77 | 0 | 88 |
| Zone C | 154 | 154 | 0 | 186 |
| Zone D | 2,818 | 2,818 | 0 | 3,398 |
| Zone E | 2,627 | 2,627 | 0 | 3,488 |
| Zone F | 61 | 61 | 0 | 89 |
| Zone G | 2,380 | 2,380 | 0 | 3,182 |
| Zone H | 1,397 | 1,397 | 0 | 1,952 |
| Total area 00 | 11,661 | 11,661 | 0 | 14,991 |
| Area 01 | 2,888 | 2,848 | 40 | 3,916 |
| Overall Total | 14,549 | 14,509 | 40 | 18,907 |
Data from Area 00 considers evictions that occurred after a court order by the Civil Defense of Maceió until December 2, 2023. Area 00 is totally evicted. 1. It does not consider large equipment, Braskem properties, and other cases that will be treated separately 2. Properties that entered PCF through the Technical Board and overlap the area set in the new Agreement are ed for by the geographical criterion
SEPTEMBER 2024 - RESIDENCES 595n16
| Eviction map areas | Identified Properties | Evicted Properties | Pending Eviction Properties | Accepted Proposals |
|---|---|---|---|---|
| Protection | 514 | 514 | 0 | 649 |
| Zone A | 1,633 | 1,633 | 0 | 1,961 |
| Zone B | 77 | 77 | 0 | 88 |
| Zone C | 154 | 154 | 0 | 186 |
| Zone D | 2,818 | 2,818 | 0 | 3,404 |
| Zone E | 2,627 | 2,627 | 0 | 3,496 |
| Zone F | 61 | 61 | 0 | 89 |
| Zone G | 2,380 | 2,380 | 0 | 3,187 |
| Zone H | 1,397 | 1,397 | 0 | 1,957 |
| Total area 00 | 11,661 | 11,661 | 0 | 15,017 |
| Area 01 | 2,888 | 2,853 | 35 | 3,927 |
| Overall Total | 14,549 | 14,514 | 35 | 18,944 |
Data from Area 00 considers evictions that occurred after a court order by the Civil Defense of Maceió until December 2, 2023. Area 00 is totally evicted. 1. It does not consider large equipment, Braskem properties, and other cases that will be treated separately 2. Properties that entered PCF through the Technical Board and overlap the area set in the new Agreement are ed for by the geographical criterion
OCTOBER 2024 - RESIDENCES mm1z
| Eviction map areas | Identified Properties | Evicted Properties | Pending Eviction Properties | Accepted Proposals |
|---|---|---|---|---|
| Protection | 514 | 514 | 0 | 649 |
| Zone A | 1,633 | 1,633 | 0 | 1,963 |
| Zone B | 77 | 77 | 0 | 89 |
| Zone C | 154 | 154 | 0 | 186 |
| Zone D | 2,818 | 2,818 | 0 | 3,409 |
| Zone E | 2,627 | 2,627 | 0 | 3,504 |
| Zone F | 61 | 61 | 0 | 89 |
| Zone G | 2,380 | 2,380 | 0 | 3,197 |
| Zone H | 1,397 | 1,397 | 0 | 1,967 |
| Total area 00 | 11,661 | 11,661 | 0 | 15,053 |
| Area 01 | 2,888 | 2,853 | 35 | 3,936 |
| Overall Total | 14,549 | 14,514 | 35 | 18,989 |
Data from Area 00 considers evictions that occurred after a court order by the Civil Defense of Maceió until December 2, 2023. Area 00 is totally evicted. 1. It does not consider large equipment, Braskem properties, and other cases that will be treated separately 2. Properties that entered PCF through the Technical Board and overlap the area set in the new Agreement are ed for by the geographical criterion
NOVEMBER 2024 - RESIDENCES 6c1f1h
| Eviction map areas | Identified Properties | Evicted Properties | Pending Eviction Properties | Accepted Proposals |
|---|---|---|---|---|
| Protection | 514 | 514 | 0 | 649 |
| Zone A | 1,633 | 1,633 | 0 | 1,963 |
| Zone B | 77 | 77 | 0 | 89 |
| Zone C | 154 | 154 | 0 | 186 |
| Zone D | 2,818 | 2,818 | 0 | 3,412 |
| Zone E | 2,627 | 2,627 | 0 | 3,506 |
| Zone F | 61 | 61 | 0 | 89 |
| Zone G | 2,380 | 2,380 | 0 | 3,202 |
| Zone H | 1,397 | 1,397 | 0 | 1,968 |
| Total area 00 | 11,661 | 11,661 | 0 | 15,053 |
| Area 01 | 2,888 | 2,855 | 33 | 3,942 |
| Overall Total | 14,549 | 14,516 | 33 | 19,007 |
Data from Area 00 considers evictions that occurred after a court order by the Civil Defense of Maceió until December 2, 2023. Area 00 is totally evicted. 1. It does not consider large equipment, Braskem properties, and other cases that will be treated separately 2. Properties that entered PCF through the Technical Board and overlap the area set in the new Agreement are ed for by the geographical criterion
DECEMBER 2024 - RESIDENCES 694hs
| Eviction map areas | Identified Properties | Evicted Properties | Pending Eviction Properties | Accepted Proposals |
|---|---|---|---|---|
| Protection | 514 | 514 | 0 | 649 |
| Zone A | 1,633 | 1,633 | 0 | 1,964 |
| Zone B | 77 | 77 | 0 | 89 |
| Zone C | 154 | 154 | 0 | 186 |
| Zone D | 2,818 | 2,818 | 0 | 3,417 |
| Zone E | 2,627 | 2,627 | 0 | 3,508 |
| Zone F | 61 | 61 | 0 | 89 |
| Zone G | 2,380 | 2,380 | 0 | 3,204 |
| Zone H | 1,397 | 1,397 | 0 | 1,971 |
| Total area 00 | 11,661 | 11,661 | 0 | 15,078 |
| Area 01 | 2,888 | 2,856 | 32 | 3,962 |
| Overall Total | 14,549 | 14,517 | 32 | 19,040 |
Data from Area 00 considers evictions that occurred after a court order by the Civil Defense of Maceió until December 2, 2023. Area 00 is totally evicted. 1. It does not consider large equipment, Braskem properties, and other cases that will be treated separately 2. Properties that entered PCF through the Technical Board and overlap the area set in the new Agreement are ed for by the geographical criterion
JANUARY 2025 - RESIDENCES 3o6c7
| Eviction map areas | Identified Properties | Evicted Properties | Pending Eviction Properties | Accepted Proposals |
|---|---|---|---|---|
| Protection | 514 | 514 | 0 | 651 |
| Zone A | 1,633 | 1,633 | 0 | 1,964 |
| Zone B | 77 | 77 | 0 | 89 |
| Zone C | 154 | 154 | 0 | 186 |
| Zone D | 2,818 | 2,818 | 0 | 3,418 |
| Zone E | 2,627 | 2,627 | 0 | 3,513 |
| Zone F | 61 | 61 | 0 | 89 |
| Zone G | 2,380 | 2,380 | 0 | 3,204 |
| Zone H | 1,397 | 1,397 | 0 | 1,972 |
| Total area 00 | 11,661 | 11,661 | 0 | 15,086 |
| Area 01 | 2,888 | 2,862 | 26 | 3,972 |
| Overall Total | 14,549 | 14,523 | 26 | 19,058 |
Data from Area 00 considers evictions that occurred after a court order by the Civil Defense of Maceió until December 2, 2023. Area 00 is totally evicted. 1. It does not consider large equipment, Braskem properties, and other cases that will be treated separately 2. Properties that entered PCF through the Technical Board and overlap the area set in the new Agreement are ed for by the geographical criterion
FEBRUARY 2025 - RESIDENCES 304ih
| Eviction map areas | Identified Properties | Evicted Properties | Pending Eviction Properties | Accepted Proposals |
|---|---|---|---|---|
| Protection | 514 | 514 | 0 | 651 |
| Zone A | 1,633 | 1,633 | 0 | 1,964 |
| Zone B | 77 | 77 | 0 | 89 |
| Zone C | 154 | 154 | 0 | 187 |
| Zone D | 2,818 | 2,818 | 0 | 3,426 |
| Zone E | 2,627 | 2,627 | 0 | 3,516 |
| Zone F | 61 | 61 | 0 | 89 |
| Zone G | 2,380 | 2,380 | 0 | 3,208 |
| Zone H | 1,397 | 1,397 | 0 | 1,975 |
| Total area 00 | 11,661 | 11,661 | 0 | 15,105 |
| Area 01 | 2,888 | 2,864 | 24 | 3,973 |
| Overall Total | 14,549 | 14,525 | 24 | 19,078 |
Data from Area 00 considers evictions that occurred after a court order by the Civil Defense of Maceió until December 2, 2023. Area 00 is totally evicted. 1. It does not consider large equipment, Braskem properties, and other cases that will be treated separately 2. Properties that entered PCF through the Technical Board and overlap the area set in the new Agreement are ed for by the geographical criterion
March 2025 - Residences 4f6l6c
| Eviction map areas | Identified Properties. | Evicted Properties | Pending Eviction Properties | Accepted Proposals |
|---|---|---|---|---|
| Protection | 514 | 514 | 0 | 651 |
| Zone A | 1,633 | 1,633 | 0 | 1,964 |
| Zone B | 77 | 77 | 0 | 89 |
| Zone C | 154 | 154 | 0 | 187 |
| Zone D | 2,818 | 2,818 | 0 | 3,427 |
| Zone E | 2,627 | 2,627 | 0 | 3,522 |
| Zone F | 61 | 61 | 0 | 89 |
| Zone G | 2,380 | 2,380 | 0 | 3,208 |
| Zone H | 1,397 | 1,397 | 0 | 1,977 |
| Total area 00 | 11,661 | 11,661 | 0 | 15,114 |
| Area 01 | 2,888 | 2,868 | 20 | 3,975 |
| Overall Total | 14,549 | 14,549 | 20 | 19,089 |
Data from Area 00 considers evictions that occurred after a court order by the Civil Defense of Maceió until December 2, 2023. Area 00 is totally evicted. 1. It does not consider large equipment, Braskem properties, and other cases that will be treated separately 2. Properties that entered PCF through the Technical Board and overlap the area set in the new Agreement are ed for by the geographical criterion
April 2025 - Residences 1a2a5n
| Eviction map areas | Identified Properties. | Evicted Properties | Pending Eviction Properties | Accepted Proposals |
|---|---|---|---|---|
| Protection | 514 | 514 | 0 | 650 |
| Zone A | 1,633 | 1,633 | 0 | 1,965 |
| Zone B | 77 | 77 | 0 | 89 |
| Zone C | 154 | 154 | 0 | 187 |
| Zone D | 2,818 | 2,818 | 0 | 3,428 |
| Zone E | 2,627 | 2,627 | 0 | 3,523 |
| Zone F | 61 | 61 | 0 | 89 |
| Zone G | 2,380 | 2,380 | 0 | 3,209 |
| Zone H | 1,397 | 1,397 | 0 | 1,977 |
| Total area 00 | 11,661 | 11,661 | 0 | 15,117 |
| Area 01 | 2,888 | 2,871 | 17 | 3,976 |
| Overall Total | 14,549 | 14,532 | 17 | 19,093 |
Data from Area 00 considers evictions that occurred after a court order by the Civil Defense of Maceió until December 2, 2023. Area 00 is totally evicted. 1. It does not consider large equipment, Braskem properties, and other cases that will be treated separately 2. Properties that entered PCF through the Technical Board and overlap the area set in the new Agreement are ed for by the geographical criterion
Click below to see monthly PCF data for commercial and mixed properties: 1n3360

May 2024 - Traders 5u2r3e
| Relocation | Compensation | ||||
|---|---|---|---|---|---|
| Eviction map areas | Properties | Properties relocated or under move | Orders that started the compensation flow | Submitted Proposals | Compensations Paid |
| Protection | 129 | 129 (100%) | 185 | 185 (100%) | 182 |
| Zone A | 310 | 310 (100%) | 344 | 344 (100%) | 336 |
| Zone B | 8 | 8 (100%) | 9 | 9 (100%) | 9 |
| Zone C | 49 | 49 (100%) | 63 | 62 (98%) | 59 |
| Zone D | 661 | 661 (100%) | 873 | 871 (99%) | 839 |
| Zone E | 780 | 780 (100%) | 1,043 | 1,042 (99%) | 981 |
| Zone F | 25 | 25 (100%) | 36 | 36 (100%) | 35 |
| Zone G | 1,006 | 1,006 (100%) | 1,373 | 1,372 (99%) | 1,295 |
| Zone H | 505 | 505 (100%) | 723 | 723 (100%) | 675 |
| Area 01 | 1035 | 1,015 (98%) | 1,502 | 1,502 (100%) | 1,404 |
| Overall Total | 4,508 | 4,488 (99%) | 6,151 | 6,146 (99%) | 5,815 |
1. Total stamps classified as an entrepreneur over the meeting to enter the compensation flow. 2. The number of claims filed in the Protected Area and Zones A, B, C, D, E, and F is greater than the respective number of relocated properties, since some properties have more than one claim (typically owner + lessee). 3. The number of properties identified considers information obtained in the field, in addition to details of the relocation and compensation claims. These figures may change as analyses progress and the documentation is submitted.
June 2024 - Traders 676v3
| Relocation | Compensation | ||||
|---|---|---|---|---|---|
| Eviction map areas | Properties | Properties relocated or under move | Orders that started the compensation flow | Submitted Proposals | Compensations Paid |
| Protection | 129 | 129 (100%) | 185 | 185 (100%) | 183 |
| Zone A | 310 | 310 (100%) | 344 | 344 (100%) | 337 |
| Zone B | 8 | 8 (100%) | 9 | 9 (100%) | 9 |
| Zone C | 50 | 50 (100%) | 64 | 63 (98%) | 59 |
| Zone D | 661 | 661 (100%) | 874 | 871 (99%) | 841 |
| Zone E | 781 | 781 (100%) | 1,043 | 1,042 (99%) | 984 |
| Zone F | 25 | 25 (100%) | 36 | 36 (100%) | 35 |
| Zone G | 1,006 | 1,006 (100%) | 1,373 | 1,373 (99%) | 1,302 |
| Zone H | 505 | 505 (100%) | 723 | 723 (100%) | 679 |
| Area 01 | 1035 | 1,016 (98%) | 1,502 | 1,502 (100%) | 1,413 |
| Overall Total | 4,510 | 4,491 (99%) | 6,153 | 6,148 (99%) | 5,842 |
1. Total stamps classified as an entrepreneur over the meeting to enter the compensation flow. 2. The number of claims filed in the Protected Area and Zones A, B, C, D, E, and F is greater than the respective number of relocated properties, since some properties have more than one claim (typically owner + lessee). 3. The number of properties identified considers information obtained in the field, in addition to details of the relocation and compensation claims. These figures may change as analyses progress and the documentation is submitted.
JULY 2024 - TRADERS 3v2z40
| RELOCATION | COMPENSATION | ||||
|---|---|---|---|---|---|
| Eviction map areas | Properties | Properties relocated or under move | Orders that started the compensation flow | Submitted Proposals | Compensations Paid |
| Protection | 129 | 129 (100%) | 185 | 185 (100%) | 184 |
| Zone A | 310 | 310 (100%) | 344 | 344 (100%) | 338 |
| Zone B | 8 | 8 (100%) | 9 | 9 (100%) | 9 |
| Zone C | 50 | 50 (100%) | 64 | 63 (98%) | 61 |
| Zone D | 661 | 661 (100%) | 872 | 871 (99%) | 844 |
| Zone E | 780 | 780 (100%) | 1,043 | 1,042 (99%) | 995 |
| Zone F | 25 | 25 (100%) | 36 | 36 (100%) | 35 |
| Zone G | 1,006 | 1,006 (100%) | 1,375 | 1,374 (99%) | 1,313 |
| Zone H | 505 | 505 (100%) | 723 | 723 (100%) | 688 |
| Area 01 | 1035 | 1,018 (98%) | 1,502 | 1,502 (100%) | 1,430 |
| Overall Total | 4,509 | 4,492 (99%) | 6,153 | 6,149 (99%) | 5,897 |
1. Total stamps classified as an entrepreneur over the meeting to enter the compensation flow. 2. The number of claims filed in the Protected Area and Zones A, B, C, D, E, and F is greater than the respective number of relocated properties, since some properties have more than one claim (typically owner + lessee). 3. The number of properties identified considers information obtained in the field, in addition to details of the relocation and compensation claims. These figures may change as analyses progress and the documentation is submitted.
AUGUST 2024 - TRADERS 1lu2s
| RELOCATION | COMPENSATION | ||||
|---|---|---|---|---|---|
| Eviction map areas | Properties | Properties relocated or under move | Orders that started the compensation flow | Submitted Proposals | Compensations Paid |
| Protection | 129 | 129 (100%) | 185 | 185 (100%) | 184 |
| Zone A | 310 | 310 (100%) | 344 | 344 (100%) | 338 |
| Zone B | 8 | 8 (100%) | 9 | 9 (100%) | 9 |
| Zone C | 50 | 50 (100%) | 64 | 63 (98%) | 61 |
| Zone D | 661 | 661 (100%) | 872 | 872 (99%) | 850 |
| Zone E | 781 | 781 (100%) | 1,043 | 1,042 (99%) | 1,001 |
| Zone F | 25 | 25 (100%) | 36 | 36 (100%) | 35 |
| Zone G | 1,006 | 1,006 (100%) | 1,375 | 1,375 (99%) | 1,332 |
| Zone H | 504 | 504 (100%) | 723 | 723 (100%) | 697 |
| Area 01 | 1036 | 1,019 (98%) | 1,505 | 1,504 (100%) | 1,444 |
| Overall Total | 4,510 | 4,493 (99%) | 6,156 | 6,153 (99%) | 5,951 |
1. Total stamps classified as an entrepreneur over the meeting to enter the compensation flow. 2. The number of claims filed in the Protected Area and Zones A, B, C, D, E, and F is greater than the respective number of relocated properties, since some properties have more than one claim (typically owner + lessee). 3. The number of properties identified considers information obtained in the field, in addition to details of the relocation and compensation claims. These figures may change as analyses progress and the documentation is submitted.
SEPTEMBER 2024 - TRADERS 49384y
| RELOCATION | COMPENSATION | ||||
|---|---|---|---|---|---|
| Eviction map areas | Properties | Properties relocated or under move | Orders that started the compensation flow | Submitted Proposals | Compensations Paid |
| Protection | 129 | 129 (100%) | 185 | 185 (100%) | 184 |
| Zone A | 310 | 310 (100%) | 344 | 344 (100%) | 340 |
| Zone B | 8 | 8 (100%) | 9 | 9 (100%) | 9 |
| Zone C | 50 | 50 (100%) | 64 | 63 (98%) | 61 |
| Zone D | 661 | 661 (100%) | 872 | 872 (100%) | 853 |
| Zone E | 782 | 782 (100%) | 1,044 | 1,042 (99%) | 1,009 |
| Zone F | 25 | 25 (100%) | 36 | 36 (100%) | 35 |
| Zone G | 1,006 | 1,006 (100%) | 1,375 | 1,375 (100%) | 1,348 |
| Zone H | 504 | 504 (100%) | 723 | 723 (100%) | 701 |
| Area 01 | 1036 | 1,023 (98%) | 1,506 | 1,504 (99%) | 1,445 |
| Overall Total | 4,511 | 4,498 (99%) | 6,158 | 6,153 (99%) | 5,995 |
1. Total stamps classified as an entrepreneur over the meeting to enter the compensation flow. 2. The number of claims filed in the Protected Area and Zones A, B, C, D, E, and F is greater than the respective number of relocated properties, since some properties have more than one claim (typically owner + lessee). 3. The number of properties identified considers information obtained in the field, in addition to details of the relocation and compensation claims. These figures may change as analyses progress and the documentation is submitted.
OCTOBER 2024 - TRADERS 3h5f72
| RELOCATION | COMPENSATION | ||||
|---|---|---|---|---|---|
| Eviction map areas | Properties | Properties relocated or under move | Orders that started the compensation flow | Submitted Proposals | Compensations Paid |
| Protection | 129 | 129 (100%) | 185 | 185 (100%) | 184 |
| Zone A | 310 | 310 (100%) | 344 | 344 (100%) | 340 |
| Zone B | 8 | 8 (100%) | 9 | 9 (100%) | 9 |
| Zone C | 50 | 50 (100%) | 64 | 63 (98%) | 61 |
| Zone D | 661 | 661 (100%) | 872 | 872 (100%) | 855 |
| Zone E | 782 | 782 (100%) | 1,045 | 1,042 (99%) | 1,012 |
| Zone F | 25 | 25 (100%) | 36 | 36 (100%) | 35 |
| Zone G | 1,006 | 1.006 (100%) | 1,375 | 1,375 (100%) | 1,351 |
| Zone H | 504 | 504 (100%) | 723 | 723 (100%) | 703 |
| Area 01 | 1,036 | 1.023 (98%) | 1,507 | 1,506 (99%) | 1,466 |
| Overall Total | 4,511 | 4.498 (99%) | 6,160 | 6,155 (99%) | 6,016 |
1. Total stamps classified as an entrepreneur over the meeting to enter the compensation flow. 2. The number of claims filed in the Protected Area and Zones A, B, C, D, E, and F is greater than the respective number of relocated properties, since some properties have more than one claim (typically owner + lessee). 3. The number of properties identified considers information obtained in the field, in addition to details of the relocation and compensation claims. These figures may change as analyses progress and the documentation is submitted.
NOVEMBER 2024 - TRADERS 75l3f
| RELOCATION | COMPENSATION | ||||
|---|---|---|---|---|---|
| Eviction map areas | Properties | Properties relocated or under move | Orders that started the compensation flow | Submitted Proposals | Compensations Paid |
| Protection | 129 | 129 (100%) | 185 | 185 (100%) | 184 |
| Zone A | 310 | 310 (100%) | 344 | 344 (100%) | 340 |
| Zone B | 8 | 8 (100%) | 9 | 9 (100%) | 9 |
| Zone C | 50 | 50 (100%) | 64 | 63 (98%) | 61 |
| Zone D | 661 | 661 (100%) | 873 | 873 (100%) | 856 |
| Zone E | 782 | 782 (100%) | 1,044 | 1,042 (99%) | 1,017 |
| Zone F | 25 | 25 (100%) | 36 | 36 (100%) | 35 |
| Zone G | 1,006 | 1,006 (100%) | 1,375 | 1,375 (100%) | 1,354 |
| Zone H | 504 | 504 (100%) | 723 | 723 (100%) | 704 |
| Area 01 | 1,036 | 1,025 (99%) | 1,507 | 1,506 (99%) | 1,468 |
| Overall Total | 4,511 | 4,500 (99%) | 6,160 | 6,156 (99%) | 6,028 |
1. Total stamps classified as an entrepreneur over the meeting to enter the compensation flow. 2. The number of claims filed in the Protected Area and Zones A, B, C, D, E, and F is greater than the respective number of relocated properties, since some properties have more than one claim (typically owner + lessee). 3. The number of properties identified considers information obtained in the field, in addition to details of the relocation and compensation claims. These figures may change as analyses progress and the documentation is submitted.
DECEMBER 2024 - TRADERS 5v4c3a
| RELOCATION | COMPENSATION | ||||
|---|---|---|---|---|---|
| Eviction map areas | Properties | Properties relocated or under move | Orders that started the compensation flow | Submitted Proposals | Compensations Paid |
| Protection | 129 | 129 (100%) | 185 | 185 (100%) | 184 |
| Zone A | 310 | 310 (100%) | 344 | 344 (100%) | 341 |
| Zone B | 8 | 8 (100%) | 9 | 9 (100%) | 9 |
| Zone C | 50 | 50 (100%) | 64 | 63 (98%) | 61 |
| Zone D | 661 | 661 (100%) | 873 | 873 (100%) | 857 |
| Zone E | 782 | 782 (100%) | 1,044 | 1,042 (99%) | 1,021 |
| Zone F | 25 | 25 (100%) | 36 | 36 (100%) | 35 |
| Zone G | 1,006 | 1,006 (100%) | 1,375 | 1,375 (100%) | 1,358 |
| Zone H | 504 | 504 (100%) | 723 | 723 (100%) | 707 |
| Area 01 | 1,038 | 1,025 (99%) | 1,510 | 1,509 (99%) | 1,481 |
| Overall Total | 4,513 | 4,500 (99%) | 6,163 | 6,159 (99%) | 6,054 |
1. Total stamps classified as an entrepreneur over the meeting to enter the compensation flow. 2. The number of claims filed in the Protected Area and Zones A, B, C, D, E, and F is greater than the respective number of relocated properties, since some properties have more than one claim (typically owner + lessee). 3. The number of properties identified considers information obtained in the field, in addition to details of the relocation and compensation claims. These figures may change as analyses progress and the documentation is submitted.
JANUARY 2025 - TRADERS 5d3b1o
| RELOCATION | COMPENSATION | ||||
|---|---|---|---|---|---|
| Eviction map areas | Properties | Properties relocated or under move | Orders that started the compensation flow | Submitted Proposals | Compensations Paid |
| Protection | 129 | 129 (100%) | 185 | 185 (100%) | 184 |
| Zone A | 310 | 310 (100%) | 344 | 344 (100%) | 341 |
| Zone B | 8 | 8 (100%) | 9 | 9 (100%) | 9 |
| Zone C | 50 | 50 (100%) | 64 | 64 (98%) | 61 |
| Zone D | 661 | 661 (100%) | 873 | 873 (100%) | 859 |
| Zone E | 782 | 782 (100%) | 1,044 | 1,044 (99%) | 1,023 |
| Zone F | 25 | 25 (100%) | 36 | 36 (100%) | 35 |
| Zone G | 1,006 | 1,006 (100%) | 1,375 | 1,375 (100%) | 1,359 |
| Zone H | 504 | 504 (100%) | 723 | 723 (100%) | 709 |
| Area 01 | 1,038 | 1,027 (99%) | 1,510 | 1,510 (99%) | 1,488 |
| Overall Total | 4,513 | 4,502 (99%) | 6,163 | 6,163 (99%) | 6,068 |
1. Total stamps classified as an entrepreneur over the meeting to enter the compensation flow. 2. The number of claims filed in the Protected Area and Zones A, B, C, D, E, and F is greater than the respective number of relocated properties, since some properties have more than one claim (typically owner + lessee). 3. The number of properties identified considers information obtained in the field, in addition to details of the relocation and compensation claims. These figures may change as analyses progress and the documentation is submitted.
FEBRUARY 2025 - TRADERS 2p4o3r
| RELOCATION | COMPENSATION | ||||
|---|---|---|---|---|---|
| Eviction map areas | Properties | Properties relocated or under move | Orders that started the compensation flow | Submitted Proposals | Compensations Paid |
| Protection | 129 | 129 (100%) | 185 | 185 (100%) | 185 |
| Zone A | 310 | 310 (100%) | 344 | 344 (100%) | 342 |
| Zone B | 8 | 8 (100%) | 9 | 9 (100%) | 9 |
| Zone C | 50 | 50 (100%) | 64 | 64 (98%) | 62 |
| Zone D | 661 | 661 (100%) | 875 | 874 (100%) | 859 |
| Zone E | 782 | 782 (100%) | 1,044 | 1,044 (99%) | 1,028 |
| Zone F | 25 | 25 (100%) | 36 | 36 (100%) | 35 |
| Zone G | 1,006 | 1,006 (100%) | 1,375 | 1,375 (100%) | 1,361 |
| Zone H | 504 | 504 (100%) | 723 | 723 (100%) | 711 |
| Area 01 | 1,038 | 1,028 (99%) | 1,510 | 1,510 (99%) | 1,492 |
| Overall Total | 4,513 | 4,503 (99%) | 6,165 | 6,164 (99%) | 6,084 |
1. Total stamps classified as an entrepreneur over the meeting to enter the compensation flow. 2. The number of claims filed in the Protected Area and Zones A, B, C, D, E, and F is greater than the respective number of relocated properties, since some properties have more than one claim (typically owner + lessee). 3. The number of properties identified considers information obtained in the field, in addition to details of the relocation and compensation claims. These figures may change as analyses progress and the documentation is submitted.
March 2025 - Traders 2f3060
| Relocation | Compensation | ||||
|---|---|---|---|---|---|
| Eviction map areas | Properties | Properties relocated or under move | Orders that started the compensation flow | Submitted Proposals | Compensations Paid |
| Protection | 129 | 129 (100%) | 185 | 185 (100%) | 185 |
| Zone A | 310 | 310 (100%) | 345 | 345 (100%) | 343 |
| Zone B | 8 | 8 (100%) | 9 | 9 (100%) | 9 |
| Zone C | 50 | 50 (100%) | 64 | 64 (100%) | 62 |
| Zone D | 661 | 661 (100%) | 874 | 874 (99%) | 861 |
| Zone E | 782 | 782 (100%) | 1,044 | 1,044 (100%) | 1,029 |
| Zone F | 25 | 25 (100%) | 36 | 36 (100%) | 35 |
| Zone G | 1,006 | 1,006 (100%) | 1,375 | 1,375 (100%) | 1,361 |
| Zone H | 504 | 504 (100%) | 723 | 723 (100%) | 712 |
| Area 01 | 1038 | 1,031 (99%) | 1,510 | 1,510 (100%) | 1,494 |
| Overall Total | 4,513 | 4,506 (99%) | 6,165 | 6,165 (100%) | 6,091 |
1. Total stamps classified as an entrepreneur over the meeting to enter the compensation flow. 2. The number of claims filed in the Protected Area and Zones A, B, C, D, E, and F is greater than the respective number of relocated properties, since some properties have more than one claim (typically owner + lessee). 3. The number of properties identified considers information obtained in the field, in addition to details of the relocation and compensation claims. These figures may change as analyses progress and the documentation is submitted.
April 2025 - Traders 4i544h
| Relocation | Compensation | ||||
|---|---|---|---|---|---|
| Eviction map areas | Properties | Properties relocated or under move | Orders that started the compensation flow | Submitted Proposals | Compensations Paid |
| Protection | 129 | 129 (100%) | 185 | 185 (100%) | 185 |
| Zone A | 310 | 310 (100%) | 345 | 345 (100%) | 344 |
| Zone B | 8 | 8 (100%) | 9 | 9 (100%) | 9 |
| Zone C | 50 | 50 (100%) | 64 | 64 (100%) | 62 |
| Zone D | 661 | 661 (100%) | 875 | 874 (99%) | 863 |
| Zone E | 782 | 782 (100%) | 1,044 | 1,044 (100%) | 1,030 |
| Zone F | 25 | 25 (100%) | 36 | 36 (100%) | 35 |
| Zone G | 1,007 | 1,007 (100%) | 1,376 | 1,376 (100%) | 1,366 |
| Zone H | 504 | 504 (100%) | 723 | 723 (100%) | 714 |
| Area 01 | 1,038 | 1,034 (99%) | 1,510 | 1,510 (100%) | 1,494 |
| Overall Total | 4,514 | 4,510 (99%) | 6,167 | 6,166 (99%) | 6,102 |
1. Total stamps classified as an entrepreneur over the meeting to enter the compensation flow. 2. The number of claims filed in the Protected Area and Zones A, B, C, D, E, and F is greater than the respective number of relocated properties, since some properties have more than one claim (typically owner + lessee). 3. The number of properties identified considers information obtained in the field, in addition to details of the relocation and compensation claims. These figures may change as analyses progress and the documentation is submitted.
For any questions and concerns, please call
0800 006 3029
Monday through Friday, 9:00 a.m. to 6:00 p.m. (except for holidays).
Free calls, including from mobile phones.